Employment Rate and Median Income
Researchers: Yoko Yoshida1, Jonathan Amoyaw2, and Rachel McLay1
Affiliation: Dalhousie University1 and the University of Saskatchewan2
Keywords: Economic outcomes, employment rate, median employment income, refugees, immigrants, landing category, Alberta, British Columbia, Manitoba, Nova Scotia, IMDB
Go To: Findings, Graphs
Summary
Economic outcomes, such as employment rate and median employment income, are crucial metrics for understanding the settlement experiences of refugees in Canada. For working age immigrants, finding a job and earning a decent wage are necessary—not only for financial stability but also for social integration, happiness, and well-being.
Using data from the 2016 Longitudinal Immigrant Database (IMDB), which combines information from immigrants’ landing records with their tax files, it is possible to study the employment outcomes of refugees over time. In this report, we look at the employment rates and median employment incomes of refugees in Nova Scotia, Manitoba, Alberta, and British Columbia for three landing cohorts: 2007-2009, 2010-2012, and 2013-2015. Figures are generated from IMDB data that has been made publicly available by Statistics Canada (STC). This report provides an example of what can be learned through the creation of customized tables using the tools and interactive applications provided on Statistics Canada’s website, found at the following link: https://bit.ly/2BQAytU (This interactive visualization tool provides a useful way of customizing mobility statistics to meet researchers’ needs and interests).
Findings
Employment Rates by Province:
Employment Rates of Refugees Compared to Other Immigrants
Median Income by Province over Time
Median Income of Refugees Compared to Other Immigrants
Graphs
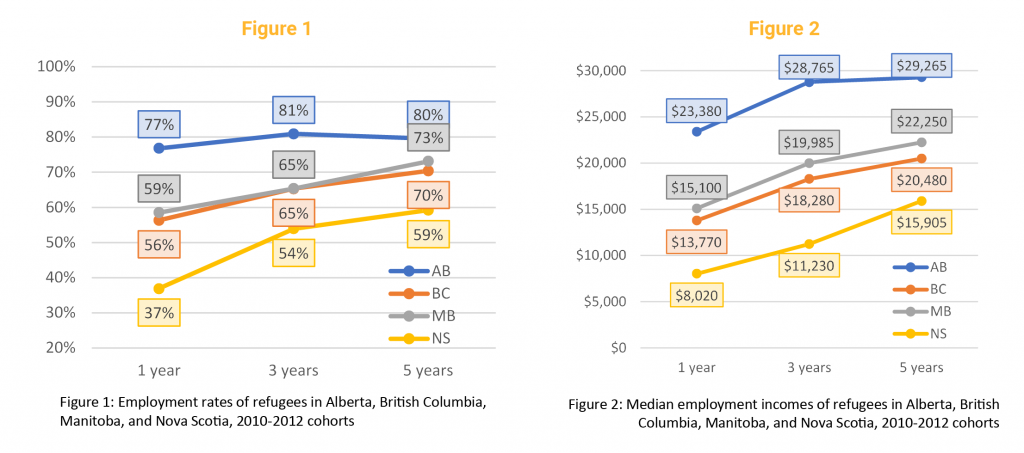
Figure 1: Employment rates of refugees in Alberta, British Columbia, Manitoba, and Nova Scotia, 2010-2012 cohorts. View Figure
Figure 2: Median employment incomes of refugees in Alberta, British Columbia, Manitoba, and Nova Scotia, 2010-2012 cohorts. View Figure
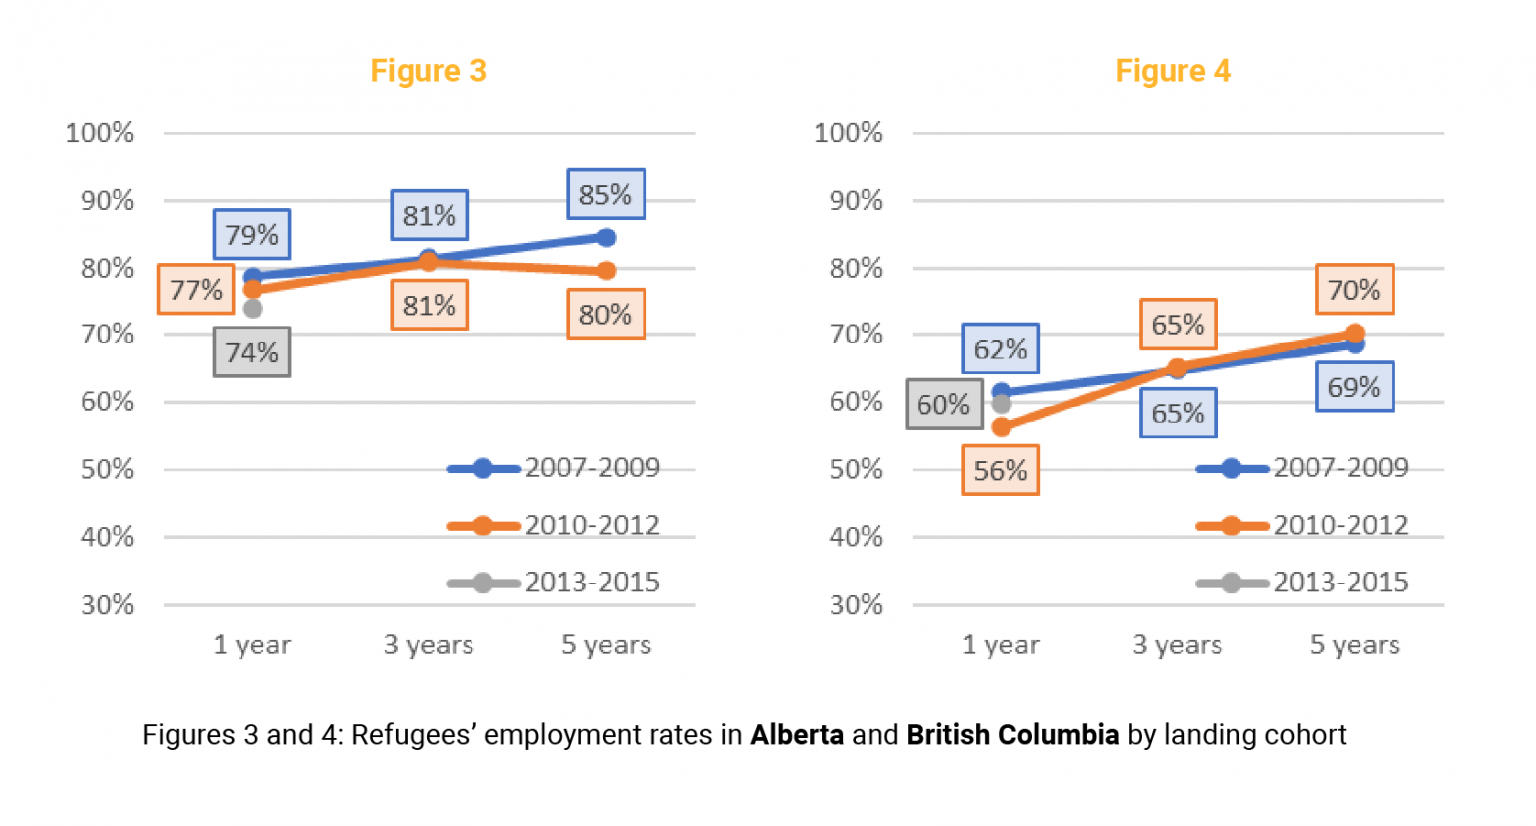
Figure 3 & 4: Refugees’ employment rates in Alberta and British Columbia by landing cohort. View Figures
Figure 5 & 6: Refugees’ employment rates in Manitoba and Nova Scotia by landing cohort. View Figures
Figure 7 & 8: Employment rates in Alberta and British Columbia by landing category for 2010-2012 cohort. View Figures
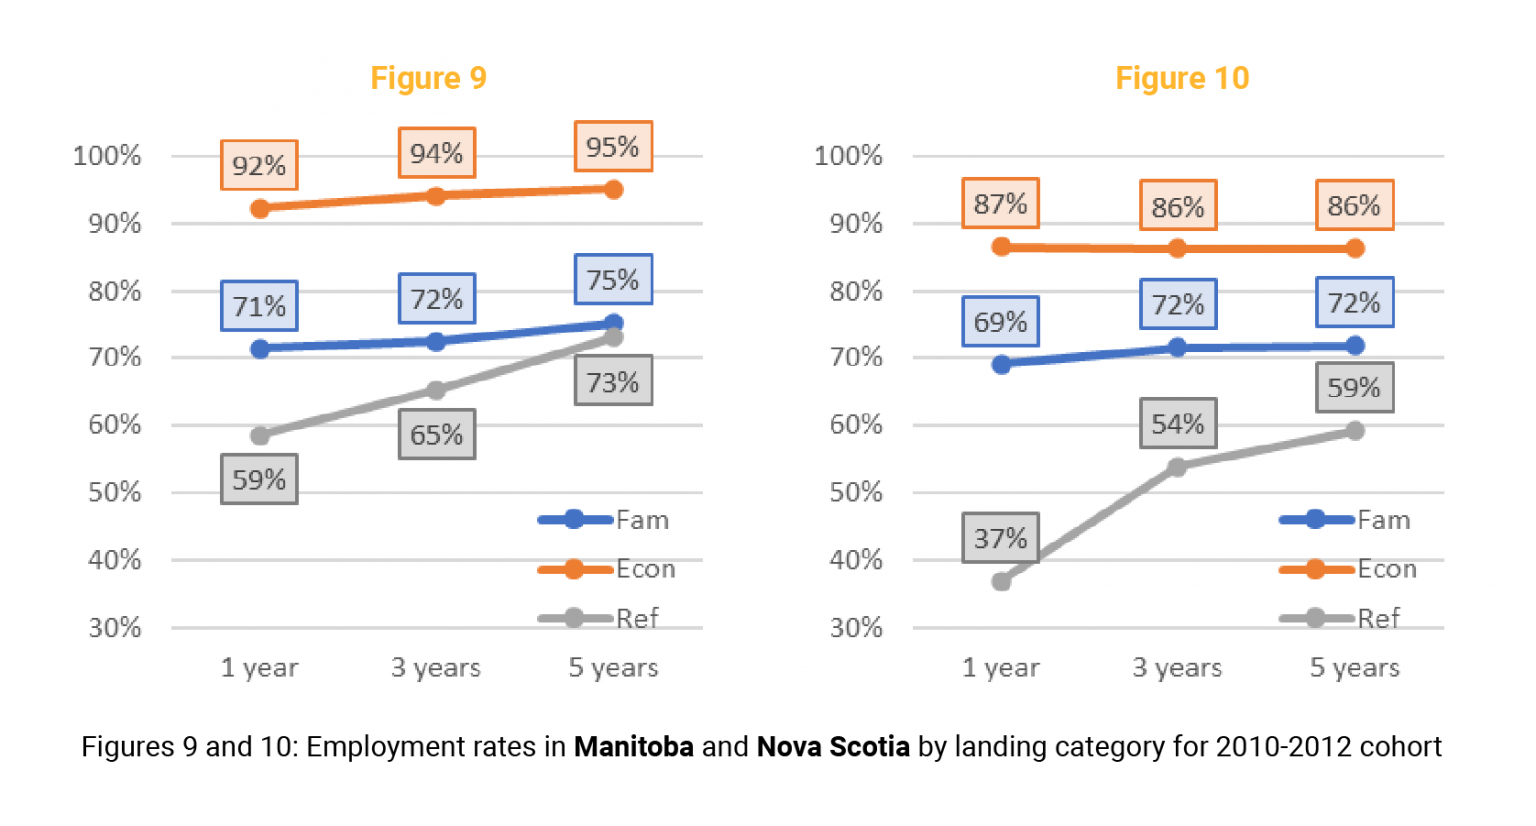
Figure 9 & 10: Employment rates in Manitoba and Nova Scotia by landing category for 2010-2012 cohort. View Figures
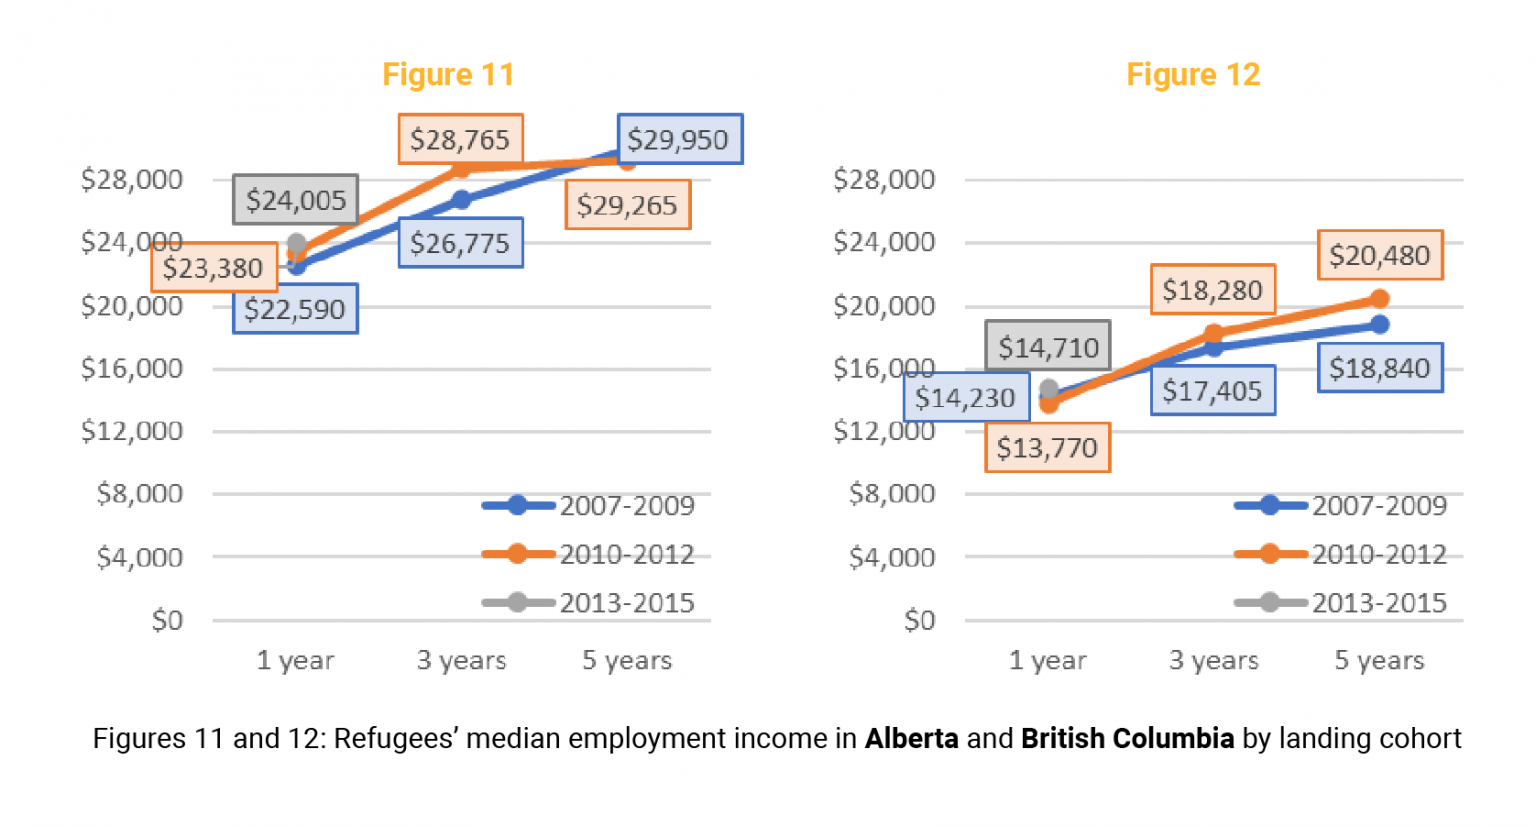
Figure 11 & 12: Refugees’ median employment income in Alberta and British Columbia by landing cohort. View Figures
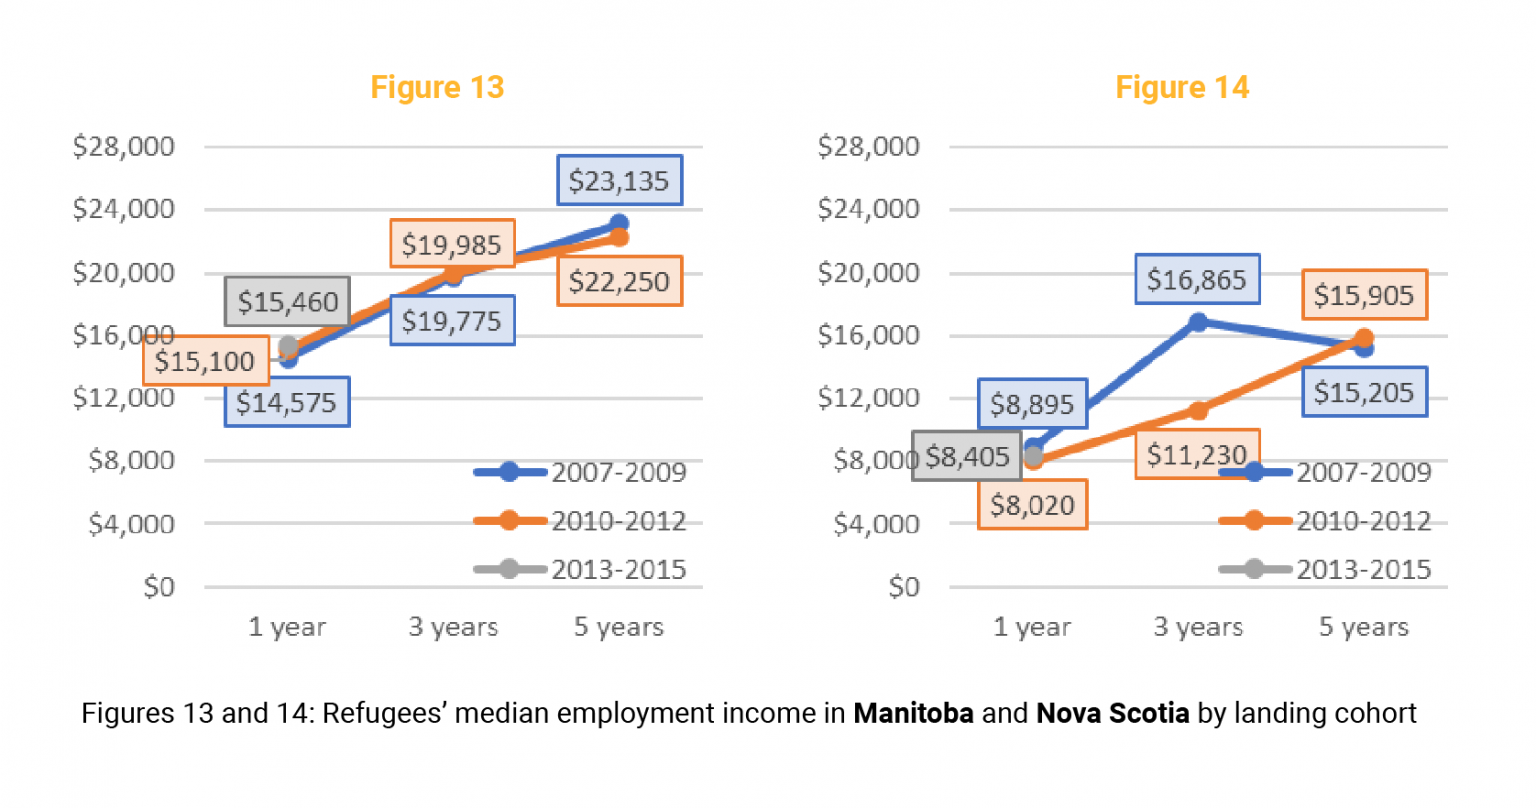
Figure 13 & 14: Refugees’ median employment income in Manitoba and Nova Scotia by landing cohort. View Figures
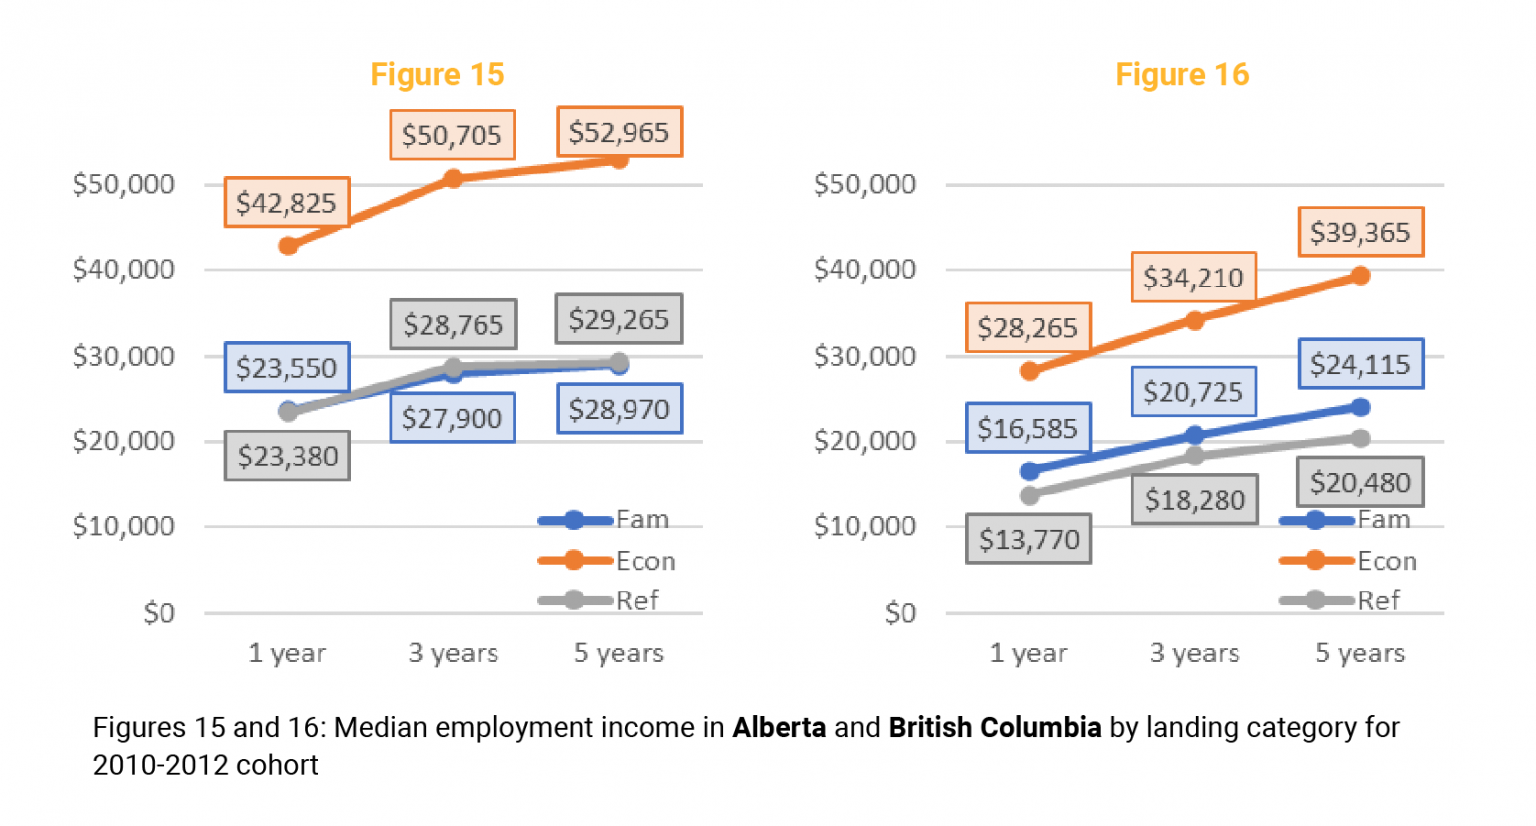
Figure 15 & 16: Median employment income in Alberta and British Columbia by landing category for 2010-2012 cohort. View Figures
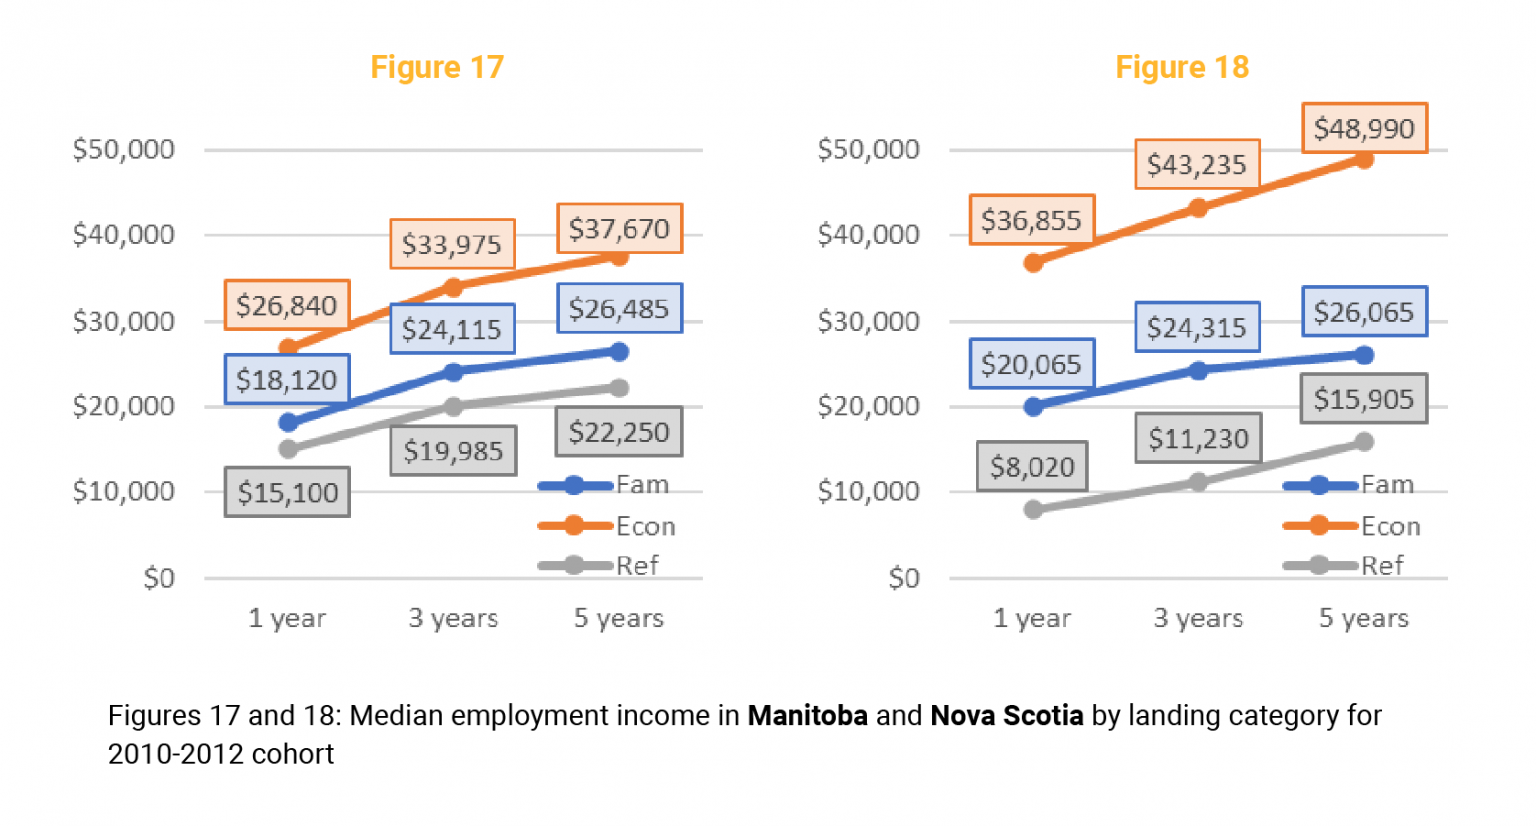
Figure 17 & 18: Median employment income in Manitoba and Nova Scotia by landing category for 2010-2012 cohort. View Figures
Explore more projects