CYRRC

Economic Outcomes of Refugees in Canada – Employment Rate

Researchers: Yoko Yoshida1, Jonathan Amoyaw2 and Rachel McLay
Affiliation: Dalhousie University1 and the University of Saskatchewan2
Keywords: Economic outcomes, employment, income, refugees, immigrants, landing category, Alberta, British Columbia, Manitoba, Nova Scotia, IMDB, data
Go to: Findings, Graphs

Summary

Employment rate is a crucial metric for understanding the settlement experiences of refugees in Canada. For working age immigrants, finding a job and earning a decent wage are necessary not only for financial stability but also for social integration, happiness, and well-being.

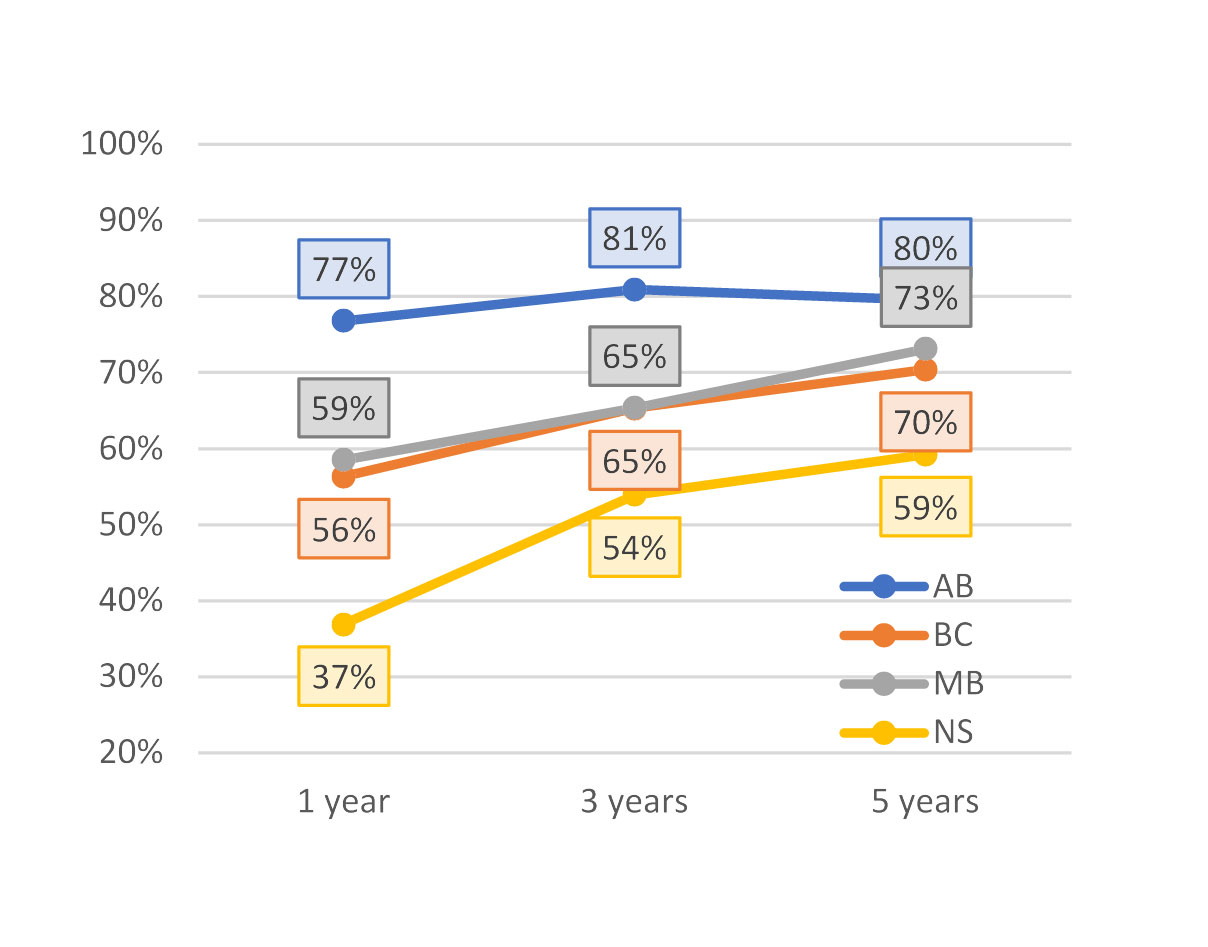
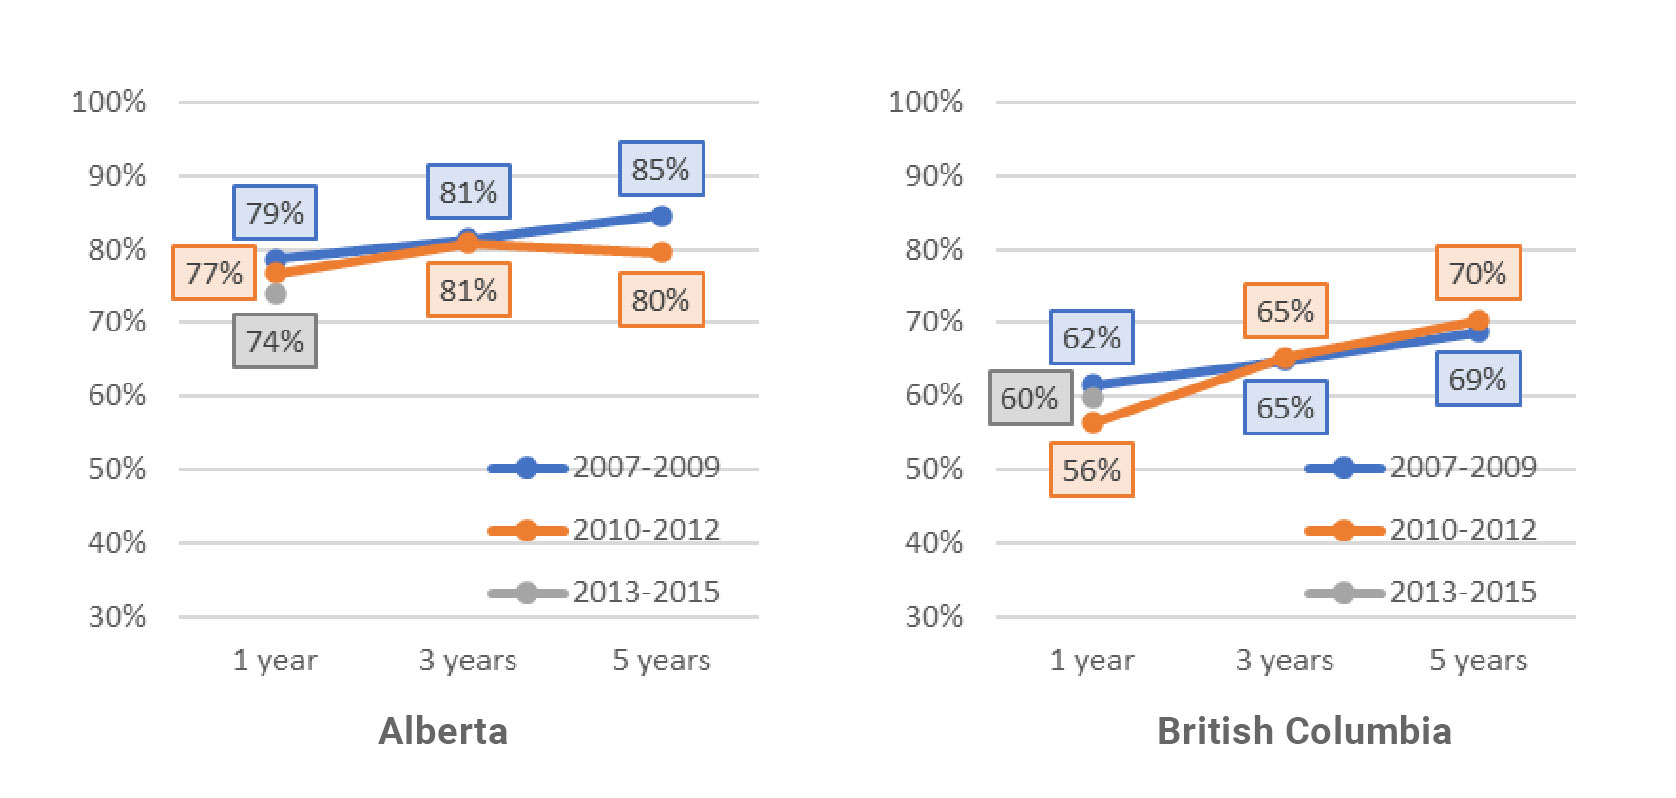
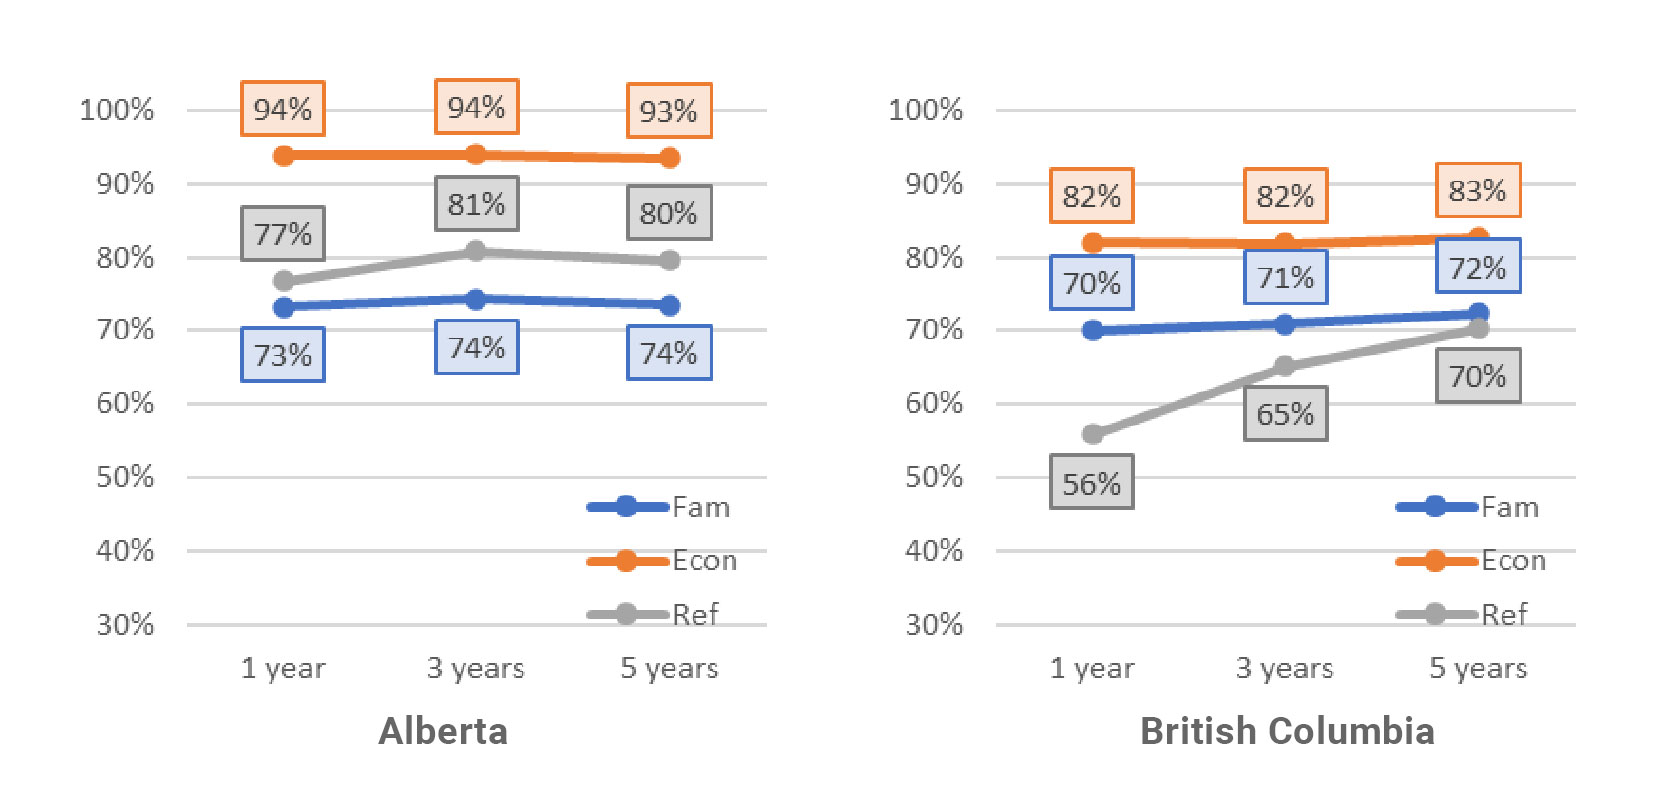
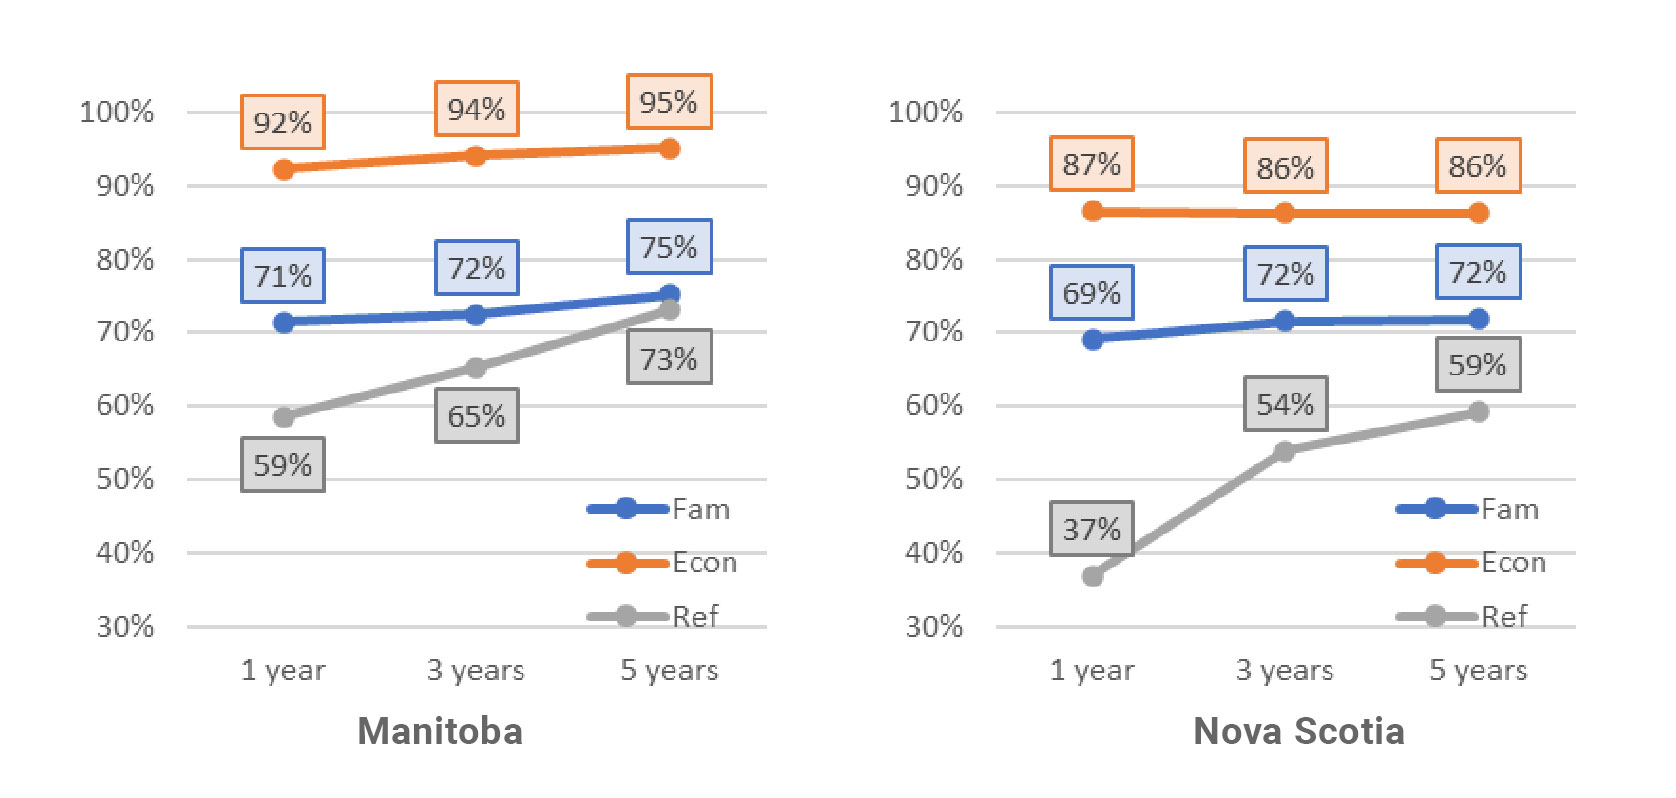
Using data from the 2016 Longitudinal Immigrant Database (IMDB), which combines information from immigrants’ landing records with their tax files, it is possible to study the employment outcomes of refugees over time. In this report, we look at median employment incomes of refugees in Nova Scotia, Manitoba, Alberta, and British Columbia for three landing cohorts: 2007-2009, 2010-2012, and 2013-2015. Figures are generated from IMDB data that has been made publicly available by Statistics Canada (STC). This report provides an example of what can be learned through the creation of customized tables using the tools and interactive applications provided on Statistics Canada’s website, found at the following link here. This interactive visualization tool provides a useful way of customizing mobility statistics to meet researchers’ needs and interests.

Findings

Employment Rates by Province:

  • Alberta consistently shows the highest refugee employment rates for all cohorts. After one year, 77% of those who arrived in the 2010-2012 cohort were earning employment income.
  • Employment rates for refugees are lowest in Nova Scotia, where only 37% of those who landed in 2010-2012 had earned employment income after one year. After five years in the province, this figure increased to 59%.

Employment Rates of Refugees Compared to Other Immigrants

  • Across all provinces, economic immigrants had the highest employment rates.
  • In Alberta, for the 2010-2012 cohort, refugees found employment at a higher rate than family class immigrants. After 5 years, 80% of refugees were earning an income compared to 74% of family class immigrants.
  • In B.C., the employment rate after one year was significantly lower for refugees than immigrants in other landing categories. Over time, the employment rate for refugees increases to near that of family class immigrants. After five years, 70% of refugees earned employment income compared to 72% of family class immigrants. Manitoba showed a similar trend.
  • The employment rate of refugees in Nova Scotia was the lowest one year after landing. Although the proportion of refugees in Nova Scotia who found employment did increase over time, the rate remained relatively low overall. After five years, only 59% of refugees were earning employment income compared to 72% of family class immigrants.

For information on median employment income of refugees in Canada, please refer to our page on economic outcomes here

Graphs

Figure 1: Employment rates of refugees in Alberta, British Columbia, Manitoba, and Nova Scotia,  2010-2012 cohorts

Figure 2 & 3: Refugees’ employment rates in Alberta and British Columbia by landing cohort. 

Figure 4 & 5: Refugees’ employment rates in Manitoba and Nova Scotia by landing cohort.

Figure 6 & 7: Employment rates in Alberta and British Columbia by landing category for 2010-2012 cohort.

Figure 8 & 9: Employment rates in Manitoba and Nova Scotia by landing category for 2010-2012 cohort.


Figure 1: Employment rates of refugees in Alberta, British Columbia, Manitoba, and Nova Scotia,  2010-2012 cohorts

Figure 2 & 3: Refugees’ employment rates in Alberta and British Columbia by landing cohort.

Figure 4 & 5: Refugees’ employment rates in Manitoba and Nova Scotia by landing cohort.

Figure 6 & 7: Employment rates in Alberta and British Columbia by landing category for 2010-2012 cohort.

Figure 8 & 9: Employment rates in Manitoba and Nova Scotia by landing category for 2010-2012 cohort.

Explore more projects

Go to Top