CYRRC

The Impacts of Literacy and Numeracy on Earnings:
Do Admission Categories Matter?

Researchers: Richard Mueller1, Khuong Troung2, and Fariborz Birjandian
Affiliation: University of Lethbridge1, McMaster University2, and Calgary Catholic Immigration Society
Research Partner:
Calgary Catholic Immigration Society
Keywords: Refugees, refugee youth, settlement and integration of refugee youth, ethnocultural and political identities of refugee youth, citizenship and refugee youth, refugee youth in Canada
Jump to: Full Infographic, Methodology, Findings, Publications & Reports

Summary

Objective: This research examines differences in literacy and numeracy skills and the economic returns to these skills, for immigrants to Canada in different admission classes and their Canadian-born counterparts.

Justification: Canada is a major immigrant-receiving nation with individuals coming from different countries, economic backgrounds, and under various immigrant policies. There are numerous studies focused on the labour market performance of immigrants compared to Canadian-born individuals. However, there is little research studying differences in basic skills (e.g., literacy and numeracy) and the labour market returns among immigrant and Canadian-born subgroups. We extend the current literature by studying the labour market outcomes of immigrants in the host country to gain a deeper understanding of how basic literacy and numeracy skills are valued across population subgroups.

Practical goal: To guide policy related to the types and timing of interventions to better assist refugees and immigrants to perform well in the Canadian education system and, subsequently, in the labour market.

Primary audience: Policy makers and service providers

Infographic Excerpt

Executive Summary

Full Infographic

Methodology

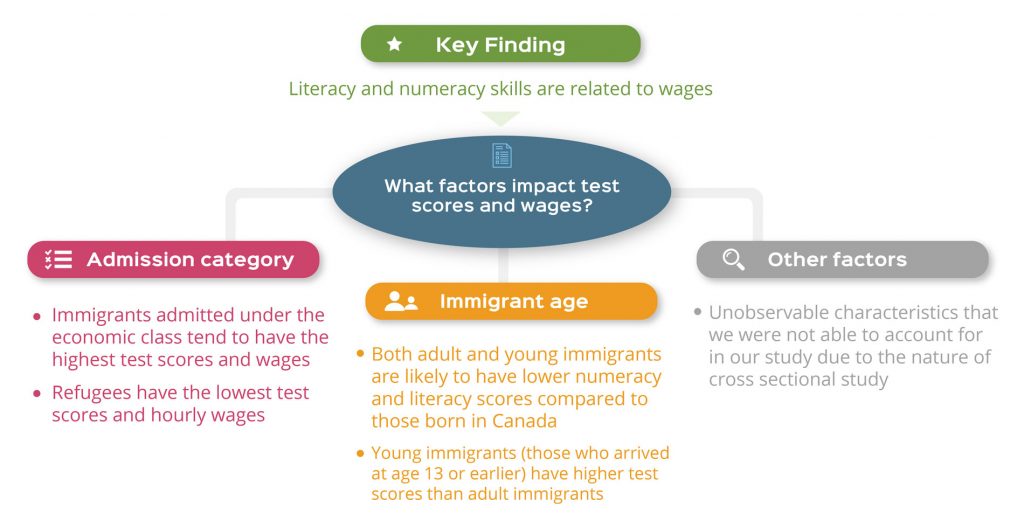
This study utilizes Statistics Canada’s 2012 Survey of Adult Skills, part of the OECD’s Programme for the International Assessment of Adult Competencies (PIAAC). Respondents are categorized into nine subpopulations: adult economic immigrants, adult refugees, adult family reunification, other adult immigrants, adult temporary residents, young refugees, young non-refugee immigrants, second- and third-generation Canadians. The sample consisted of 17,891 individuals, aged 25 to 65 years old; 3,944 fall into one of the immigrants categories and the remaining 13,947 are second- or third-generation Canadians. It excluded Indigenous populations, those with missing immigration information, and Canadians at birth who are born outside of Canada. Young immigrants were defined as those who arrived in Canada when they were 13 years old or younger. Adult immigrants are those who arrived in Canada older than 13 years.

Thirty-eight percent of male immigrants are economic immigrants and 34% are family reunification class. The family reunification class accounts for 41% of all female immigrants, with economic immigrants accounting for 31%. The proportion of male refugees is almost double that of female refugees.

Findings

  • Both adult and young immigrants (those who arrived in Canada at age 13 or younger) do not perform as well on literacy and numeracy tests as those born in Canada, although young immigrants have higher test scores than adult immigrants.

  • After accounting for differences in educational levels, whether individuals obtain their highest degree overseas, differences in regional labour markets, and test scores, adult economic immigrants have similar earnings compared to Canadian-born individuals.
  • Adults in the refugee or family reunification categories earn about 14-18% less than Canadian-born counterparts.

  • Literacy and numeracy skills are related to wages:

    A 1-point increase in literacy corresponds to a wage premium of 8% for men and 9% for women.

    A 1-point increase in numeracy is associated with 10% wage premium for men and women.

    The effects of literacy and numeracy on wages are the same from immigrants and Canadian-born individuals.

  • Immigrants tend to be concentrated in Canada’s large urban areas, with about 90% of all immigrants in these locations, compared to only about 50% of those born in Canada.

Explore more projects

Go to Top