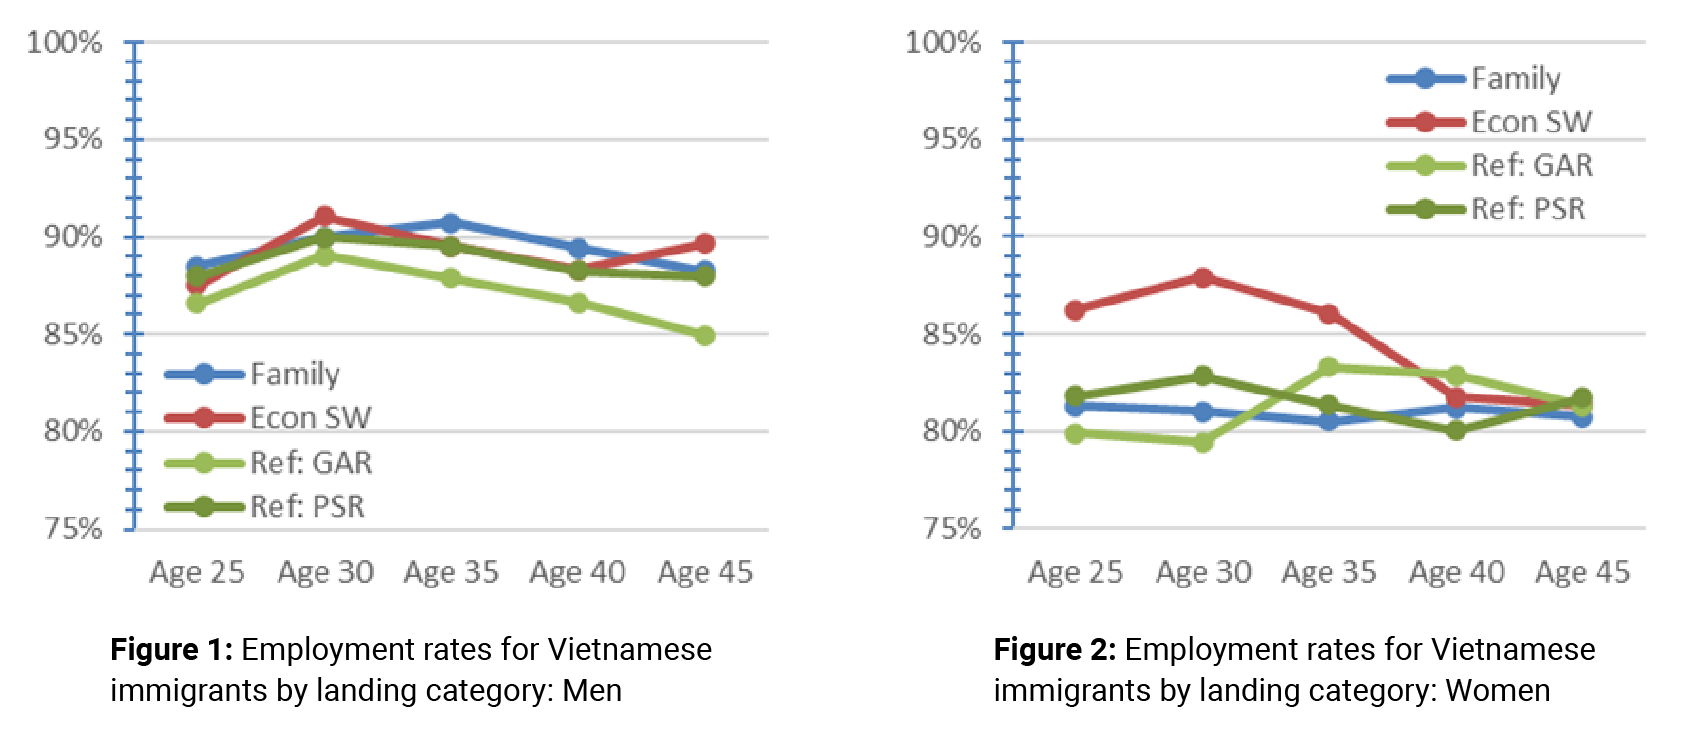
Figures 1 & 2: Employment rates for Vietnamese immigrants by landing category: Men and Women
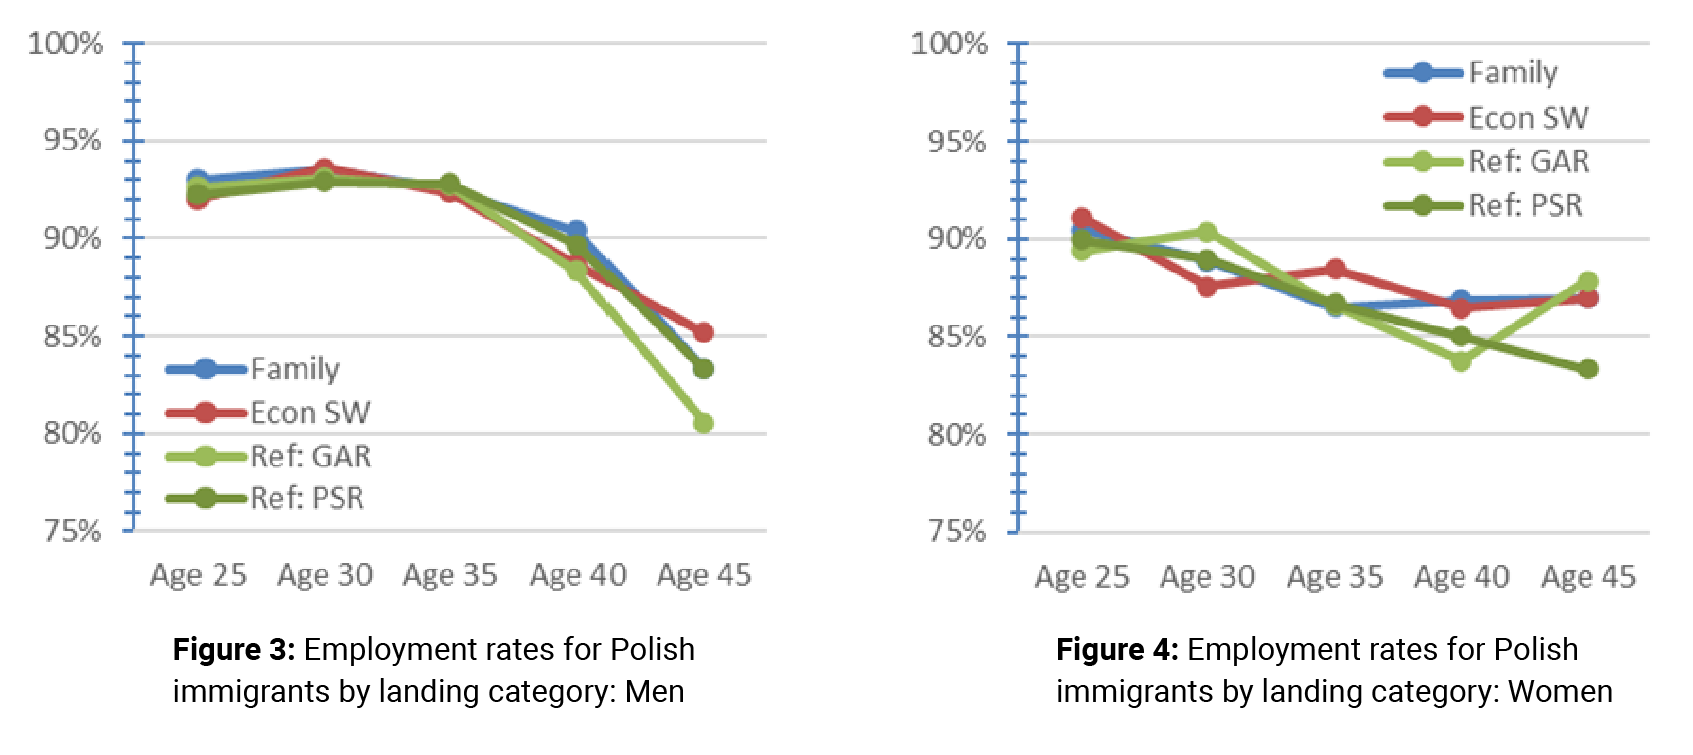
Figures 3 & 4: Employment rates for Polish immigrants by landing category: Men and Women
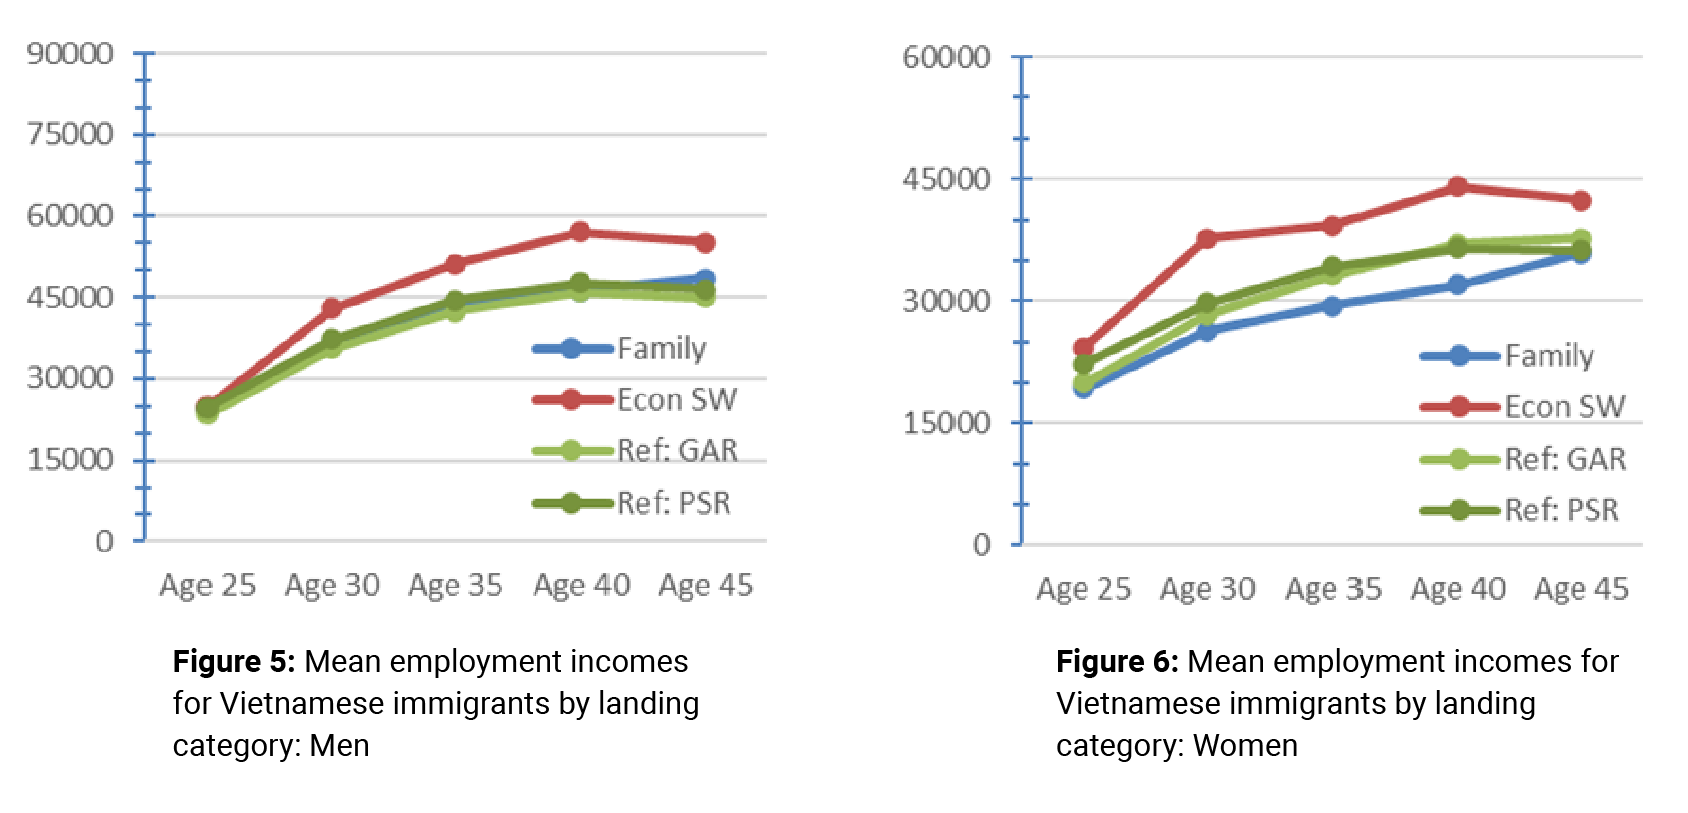
Figures 5-6: Mean employment incomes for Vietnamese immigrants by landing category: Men and Women
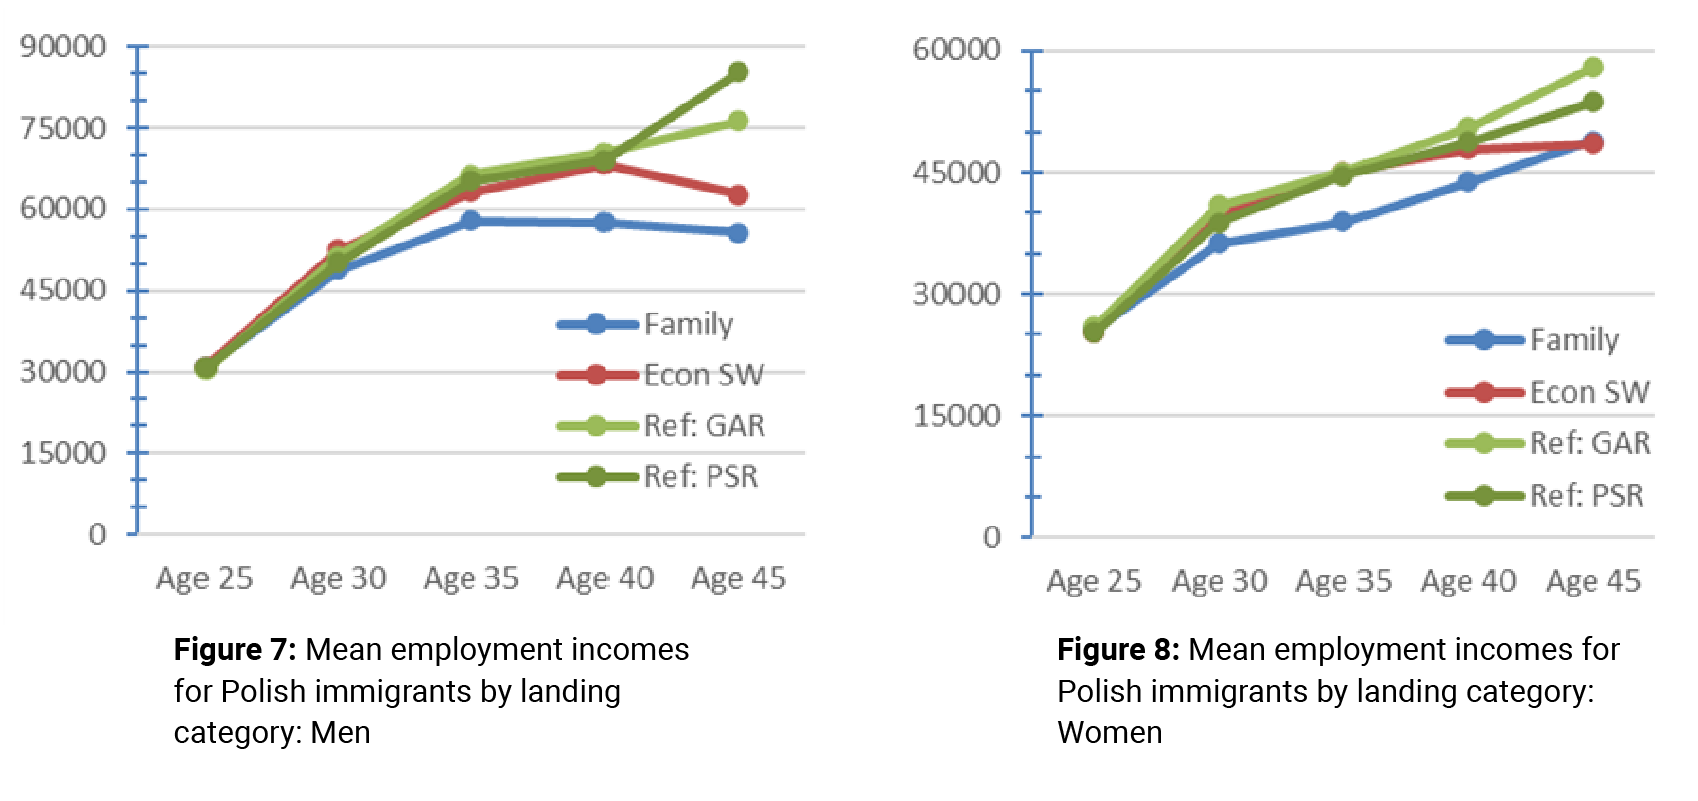
Figures 7-8: Mean employment incomes for Polish immigrants by landing category: Men and Women
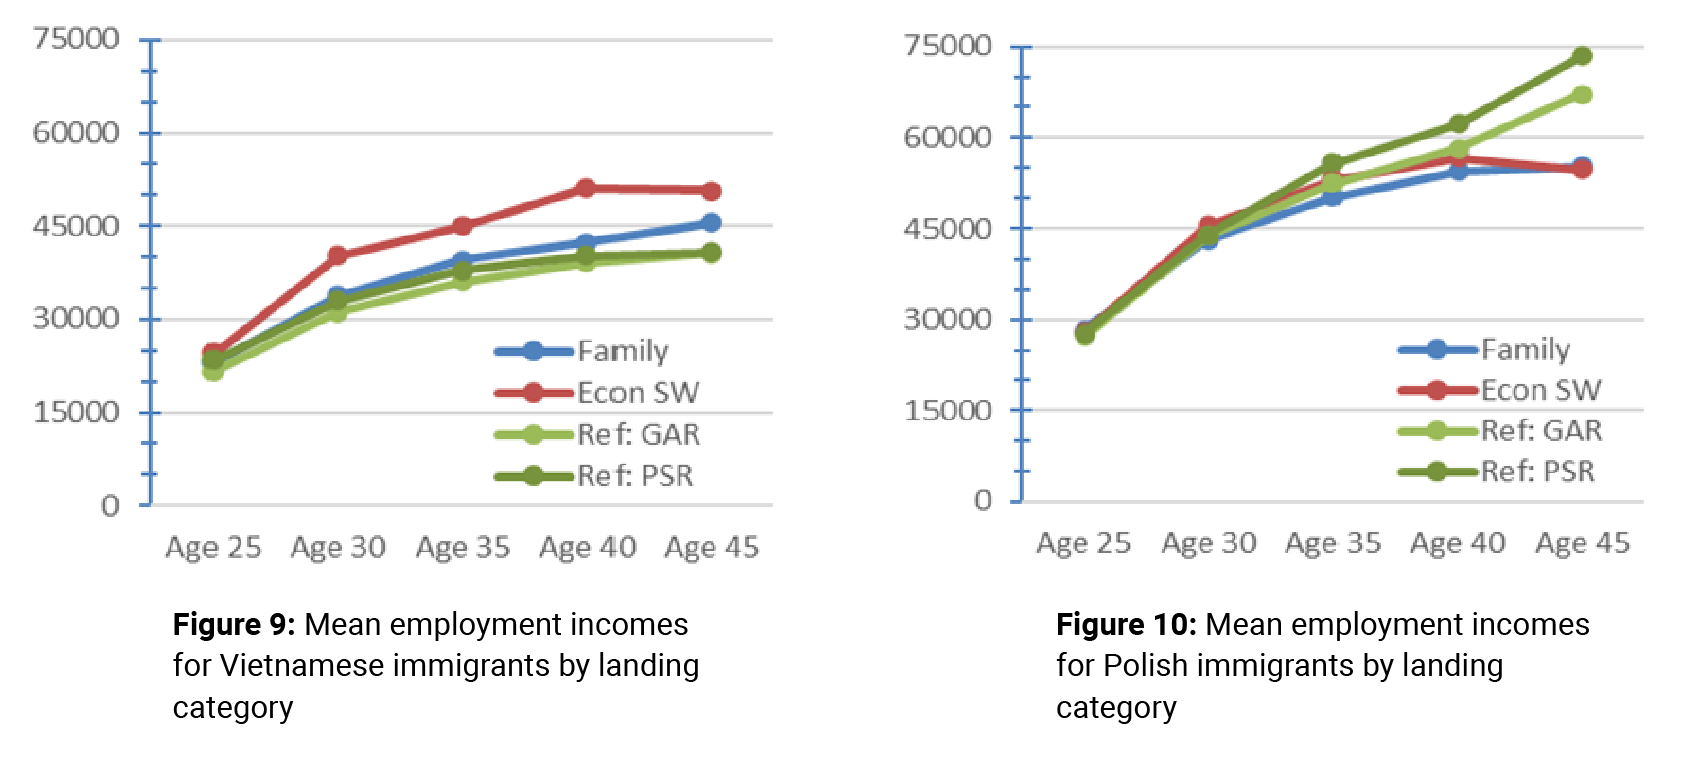
Figures 9 & 10: Mean employment incomes for Vietnamese and Polish immigrants by landing category